
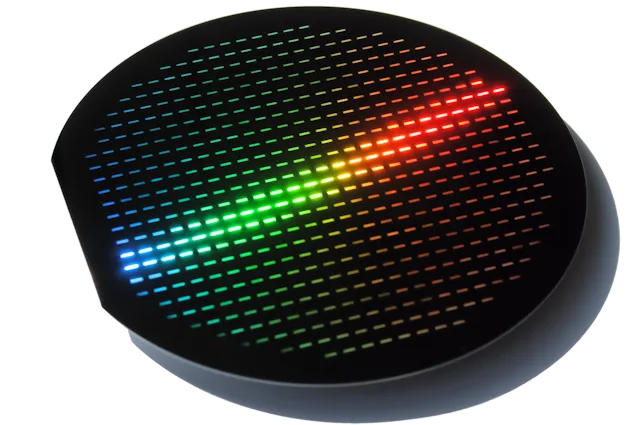
Wafer-level MEMS
The sensing platform starts at wafer level, where optical MEMS structures are fabricated with scalability in mind.
Technology
CEKO combines microfabricated sensing structures with optical readout. The passive sensing point can be positioned close to the physics of interest while interrogation and system electronics remain outside the asset.
Principles
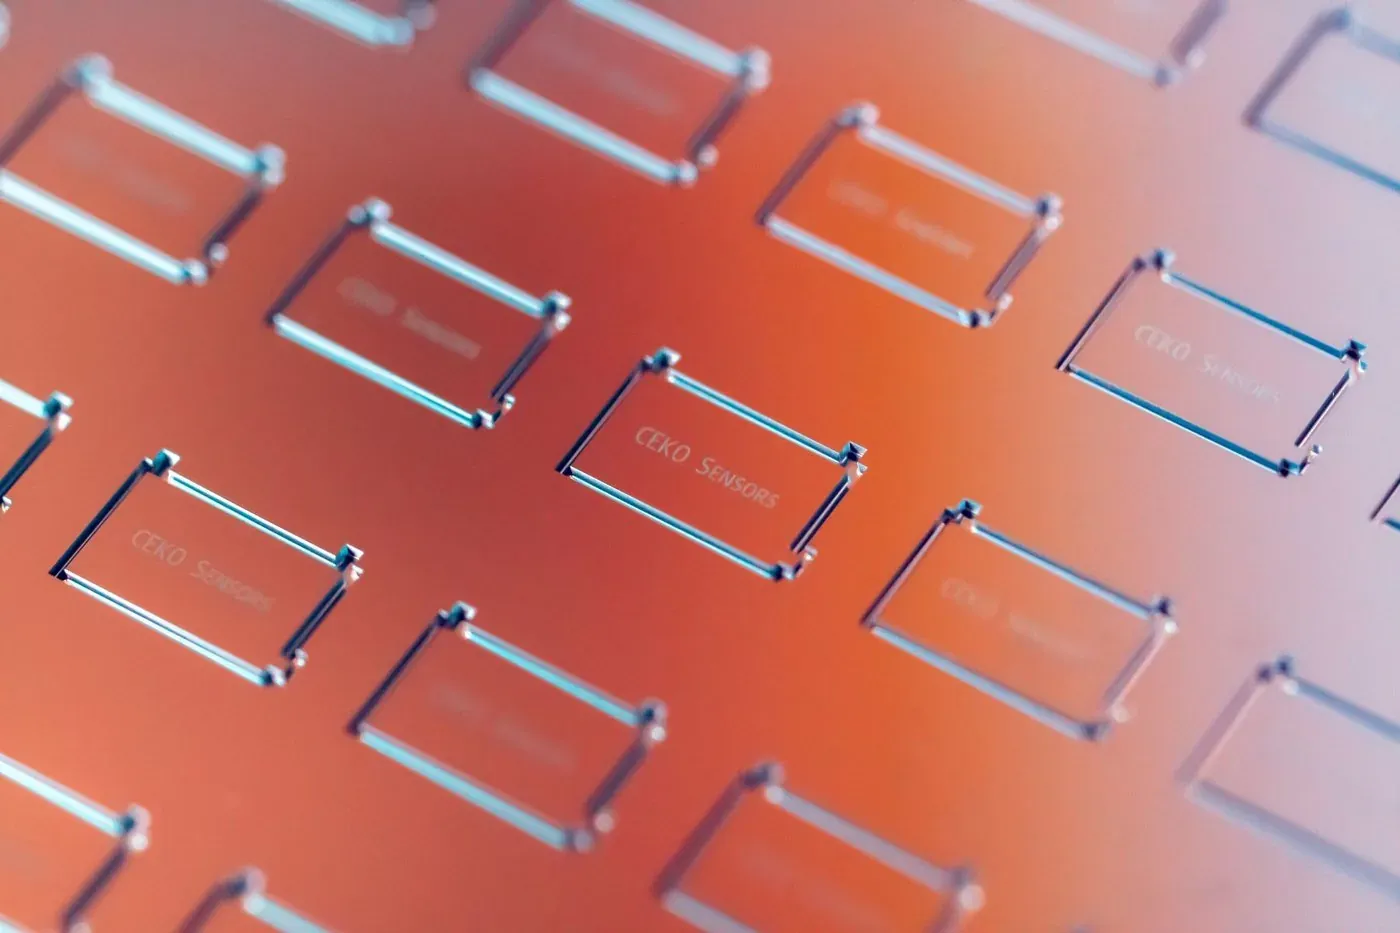
The platform combines MEMS structures, optical signal transport and external interrogation in one scalable measurement architecture.
The sensing platform starts at wafer level, where optical MEMS structures are fabricated with scalability in mind.

Physical change is translated into an optical response that can be transported without bringing conventional electronics into the sensing point.
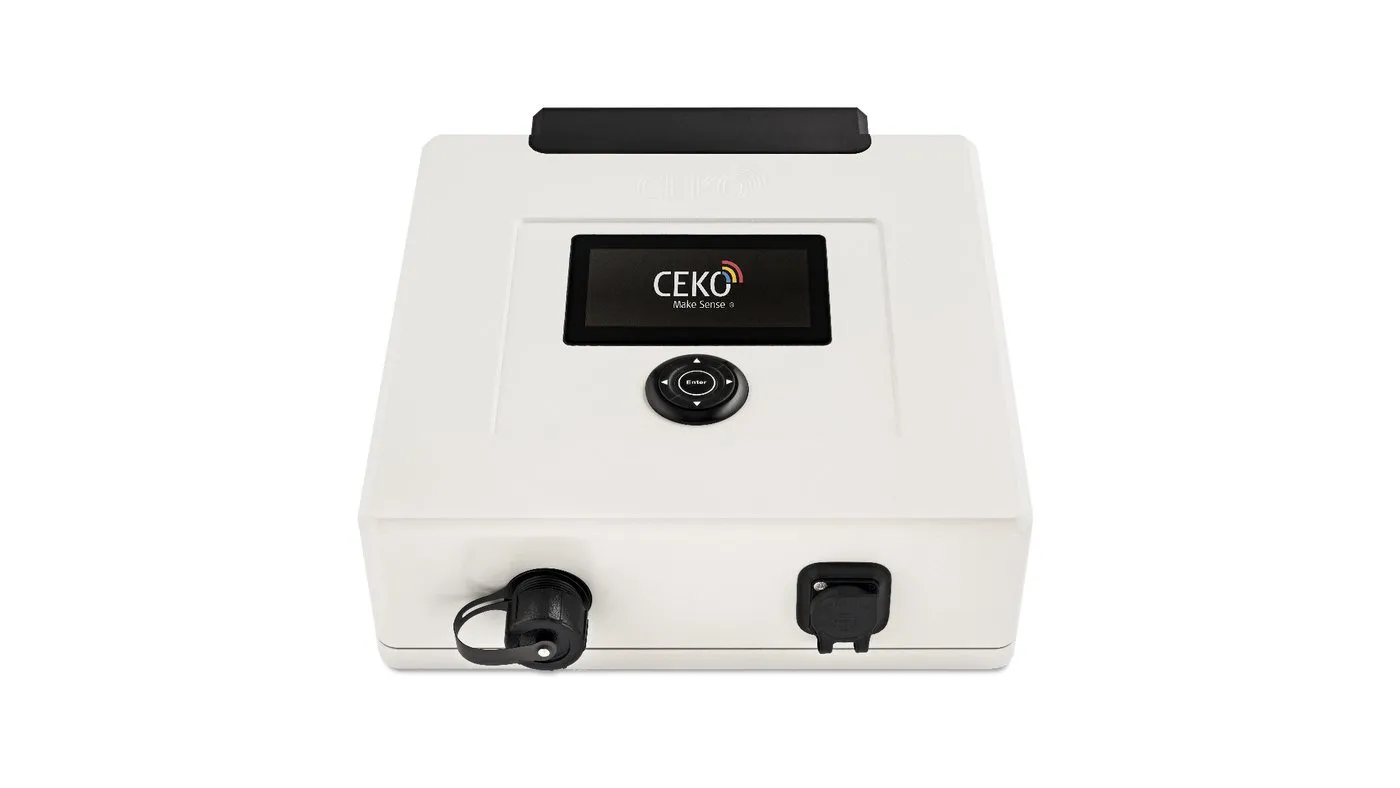
The sensing technology integrates with multiplexing, optical interrogation and data systems to form a complete monitoring platform.
Architecture
Multiplexing allows several optical sensing points to be interrogated within one broader system architecture.
Try the optical sensing simulator to the right and explore how optical sensors can be monitored simultaneously to create powerful monitoring systems. You can click the expand button in the top right corner of the simulator to make it larger.
Click a sensor to connect it, adjust its input, and watch the optical peak and decoded measurement respond.
Connect: Click a sensor card in the left panel. Up to three sensors can share the same fiber.
Adjust: Use the input sliders to change heat, shaking, load, or pressure.
Observe: White light travels from the SDAS to each sensor and returns in that sensor’s color.
Understand the peaks: Each colored peak belongs to the sensor with the same color. Its horizontal position represents the reflected wavelength. When the physical condition changes, the wavelength shifts and the peak moves. The SDAS fits that position and converts it into the physical value shown below.
Representative performance view
The figure compares sensor sensitivity and maximum operating frequency using a figure of merit derived for a harmonic oscillator. Each point represents a specific CEKO sensor or a frequency-modulated optical sensor reported by competitors or in the scientific literature.
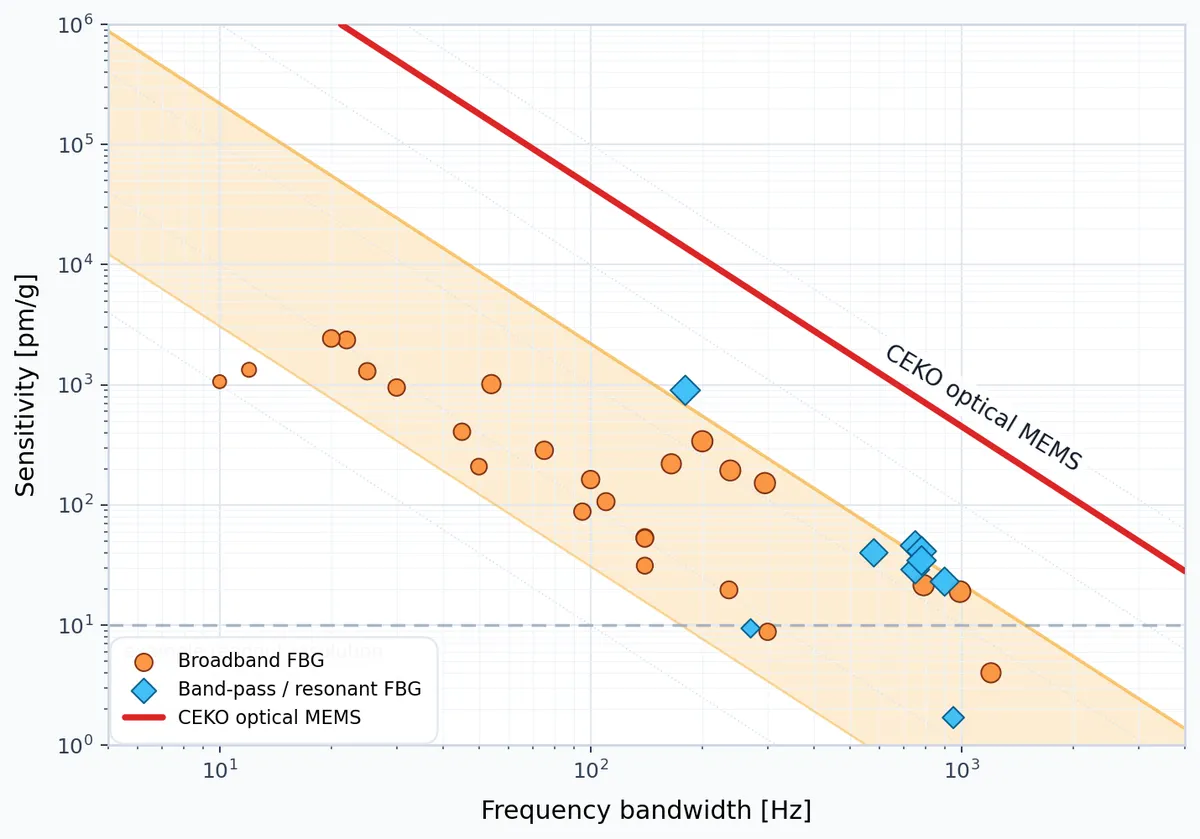
CEKO optical MEMS sensors combine high sensitivity with substantially higher usable bandwidth than conventional fully optical and frequency-modulated sensing technologies, including FBG-based sensors.
Full system
CEKO develops the full chain from sensing point and optical interrogation to application integration, deployment and usable operational data.
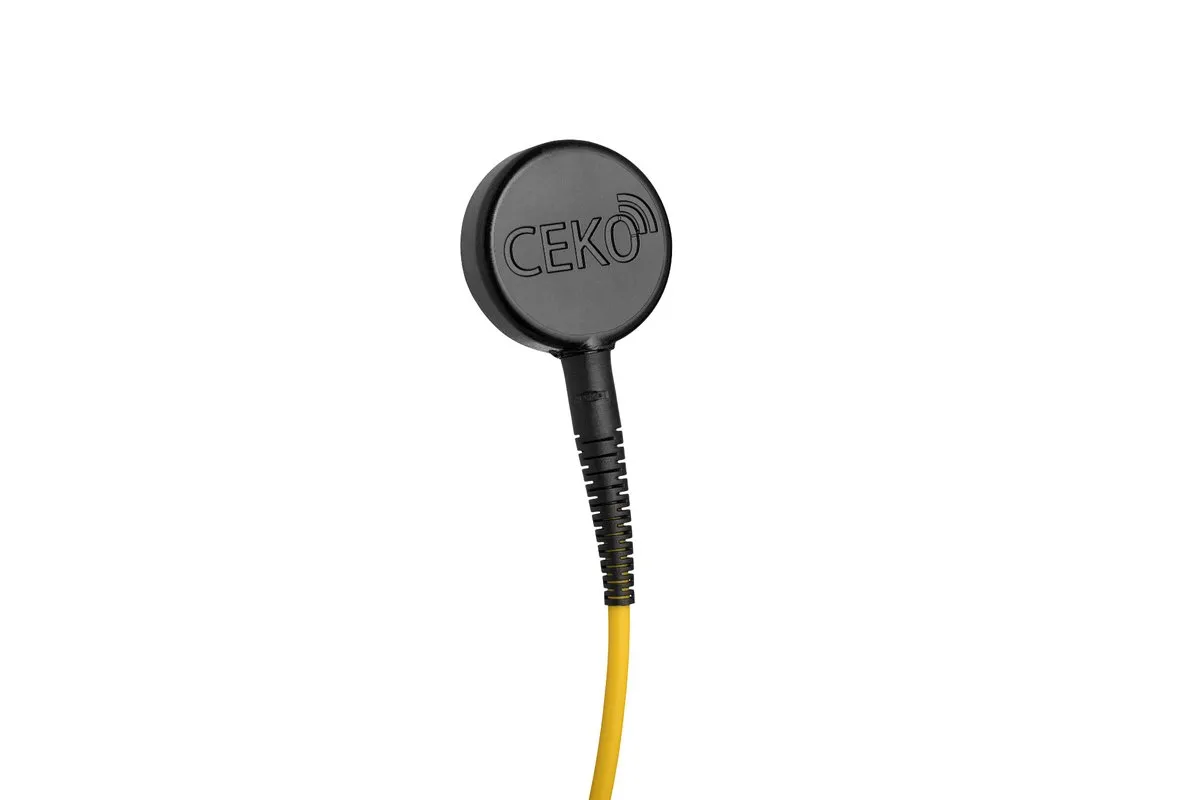
Passive optical MEMS adapted to the measurement location.
SDAS Insight handles readout, control and data handling outside the asset.
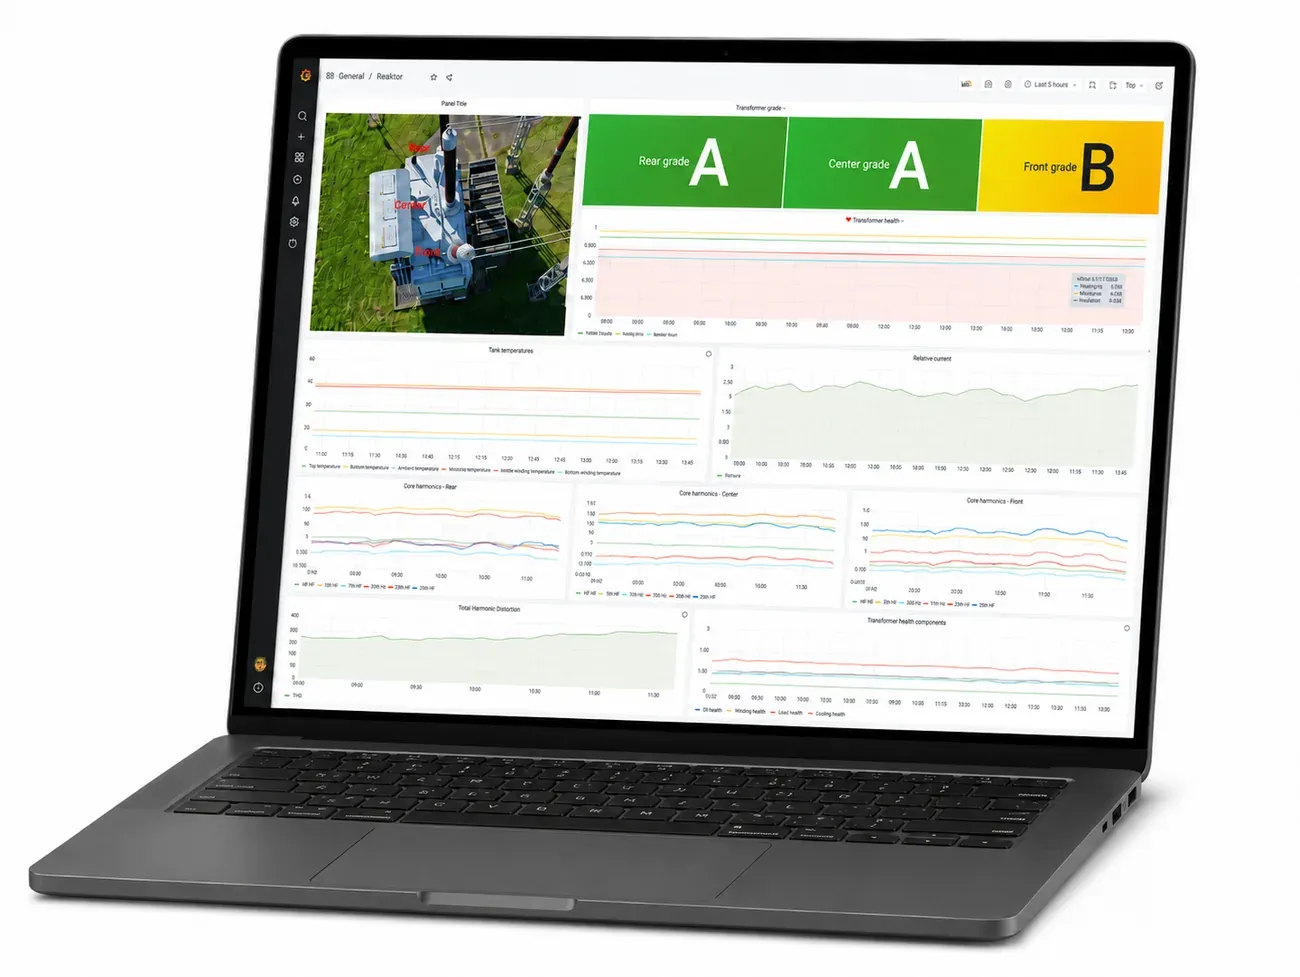
Operators and partners see trends, dashboards and condition information rather than raw optical signals.